Find the slow query, get the index to fix it, and see the expected
latency drop — before you ship. On any PostgreSQL, anywhere it runs.
Delivering comprehensive, real-time diagnostics and prescriptive
recommendations to optimize PostgreSQL stability,
and exceptional performance.
Works with every PostgreSQL deployment
A single Rust binary. Reads pg_stat_* views with a read-only role. No write access to your data, ever.
Works on RDS, Aurora, Supabase, Neon, Cloud SQL, Azure, or self-hosted. We detect the environment and pick the right collector.
Ranked index, vacuum and config recommendations with estimated impact. Apply from the dashboard or copy the SQL.
EXPLAIN ANALYZE cost deltas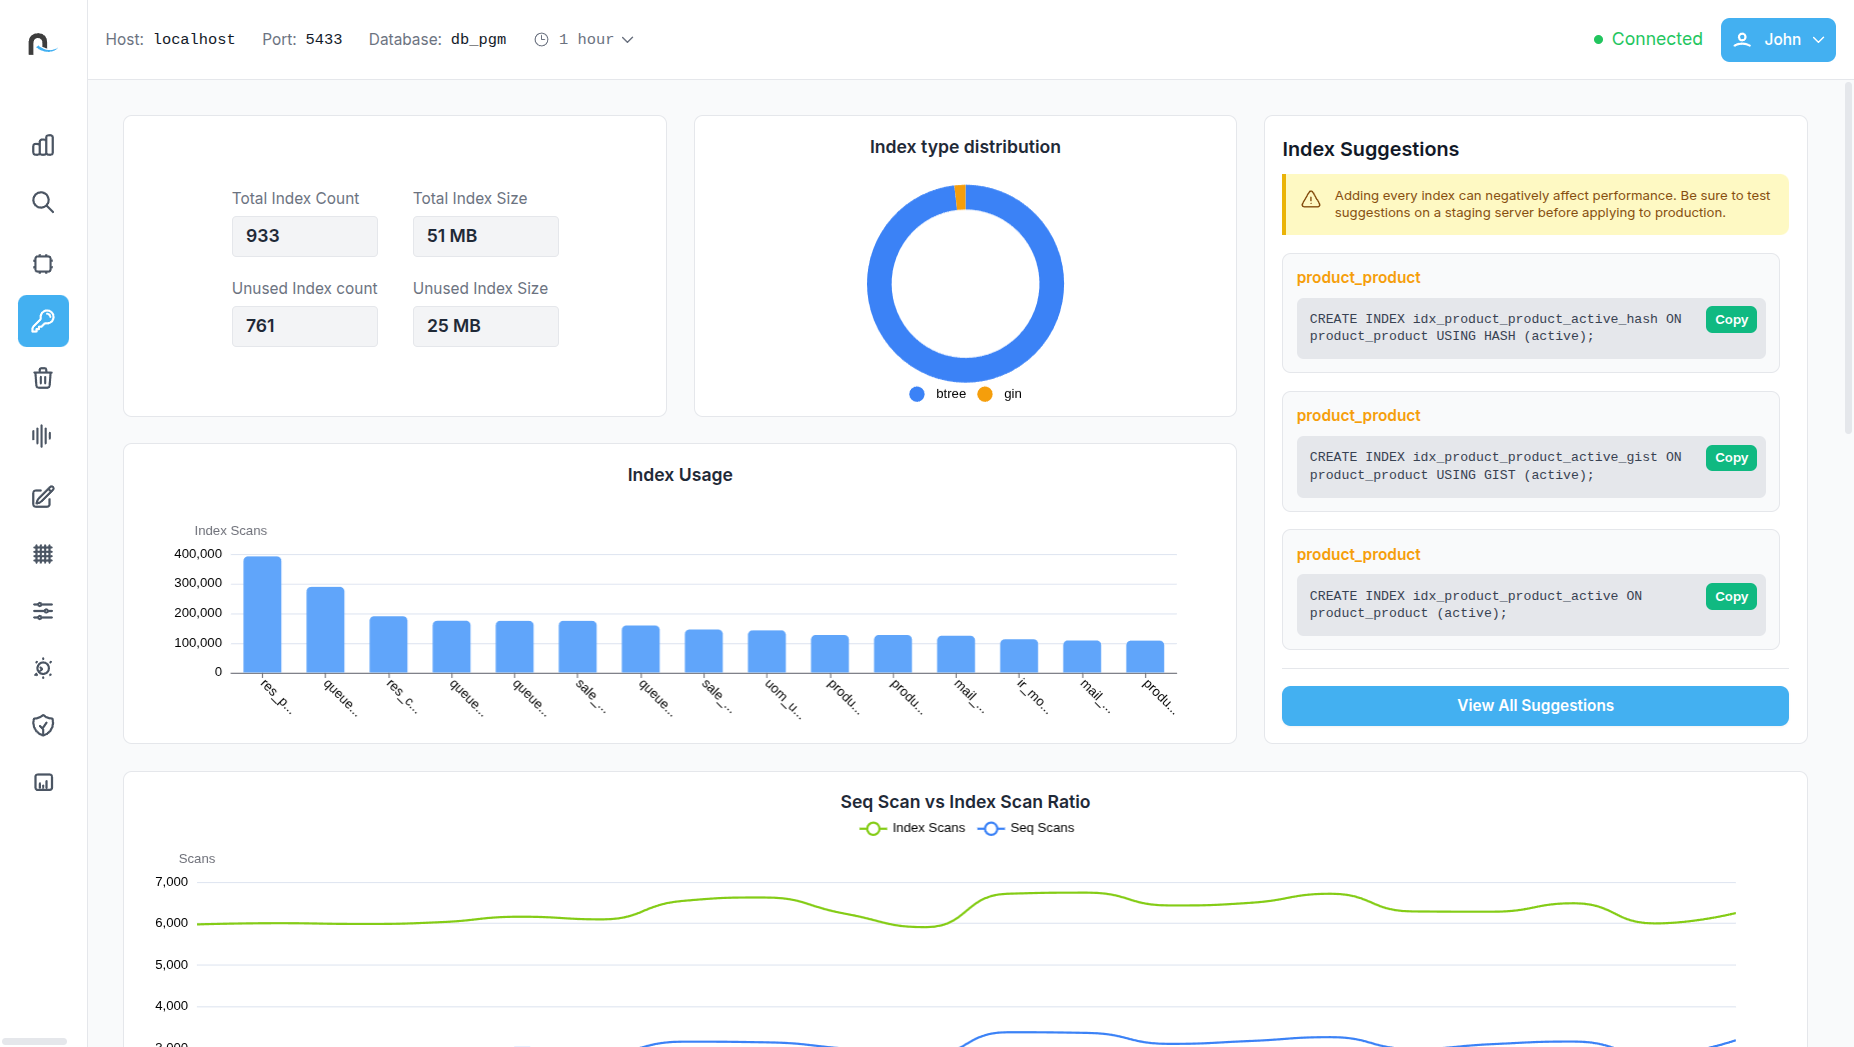
postgresql.conf and why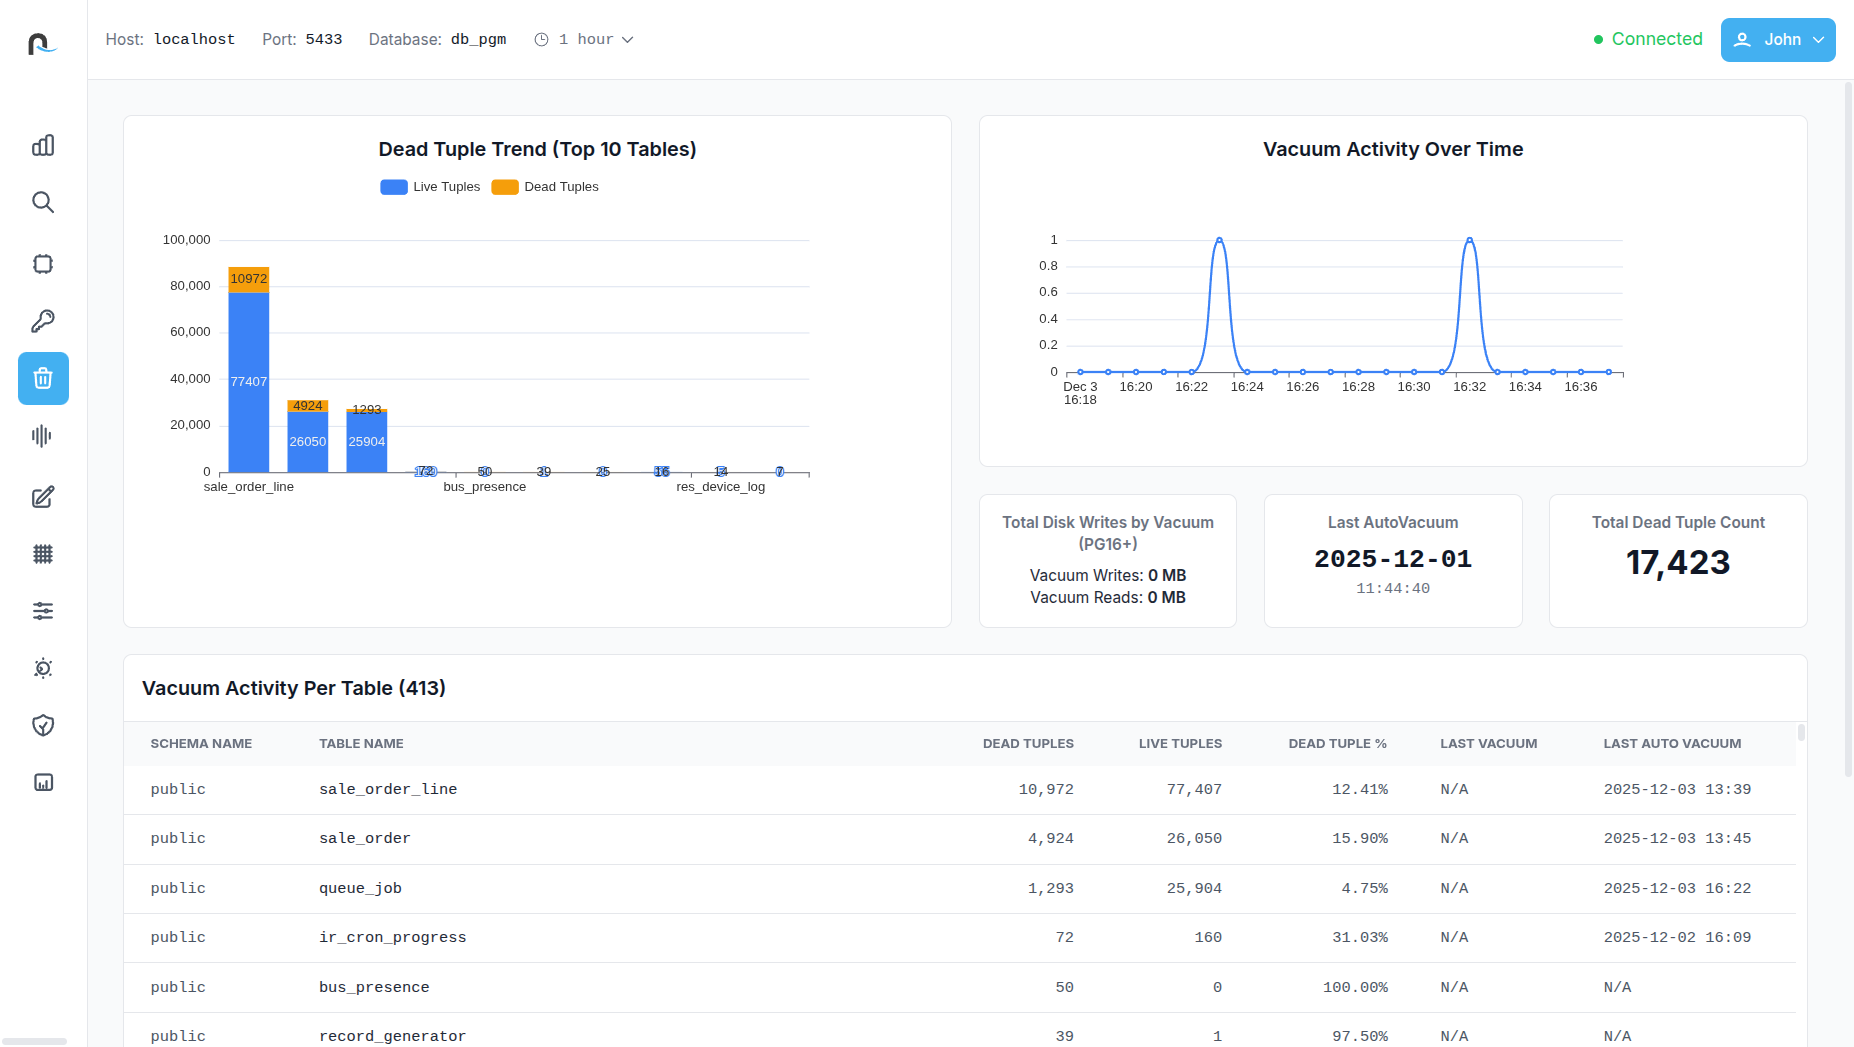
Deployment-agnostic
Self-hosted? You get kernel-level per-query metrics. RDS? You get CloudWatch-depth without a collector stack. One tool, one UX, every deployment.
No fabricated wins. We show where competitors beat us too you're going to check anyway.
| PGTuner | pganalyze | Datadog | Prom + Grafana | |
|---|---|---|---|---|
| Ranked, apply-ready fix recommendations | index · vacuum · config | index only | — | — DIY |
| Works on RDS, Supabase, self-hosted with same UX | dual-agent architecture | RDS limited | generic | DIY per target |
| Visual query plan diff | — | — | — | |
| Self-hosted collector option | single Rust binary | enterprise tier | agent | native |
| Starting price | $0 free tier | $149 / mo | $15 / host + usage | Infra only |
| SOC 2 Type II | in progress | N/A | ||
| Named enterprise customers | launch partners | Atlassian, DuckDuckGo | many | N/A |
Built by
Cybrosys Technologies
PostgreSQL consultants for 15+ years, managing production databases for enterprise clients across APAC and EMEA. PGTuner is what we built internally.
cybrosys.comSelf-hostable
Run it on your own infra
The collection agent is a single binary teams with compliance requirements that block SaaS can run the full pipeline on their own infrastructure. No metrics leave your network.
Read the spec
Security posture
Read-only role grants, TLS in transit, encryption at rest, self-hosted option for compliance. SOC 2 Type II in progress not claimed.
31
kernel-level metrics
12
purpose-built dashboards
8
postgres platforms
5 min
to first recommendation

PGTuner provides a comprehensive snapshot of your database’s overall health, giving teams instant visibility into active connections, database size and its growth rate, table count, server uptime, cache hit ratio, and dead tuple percentage. It also includes rich visualizations—such as active connections over time, CPU utilization trends, cache hit ratio trajectories, and transaction statistics per table. This consolidated view helps identify early warning signs, monitor workload patterns, and maintain a consistently healthy PostgreSQL environment.

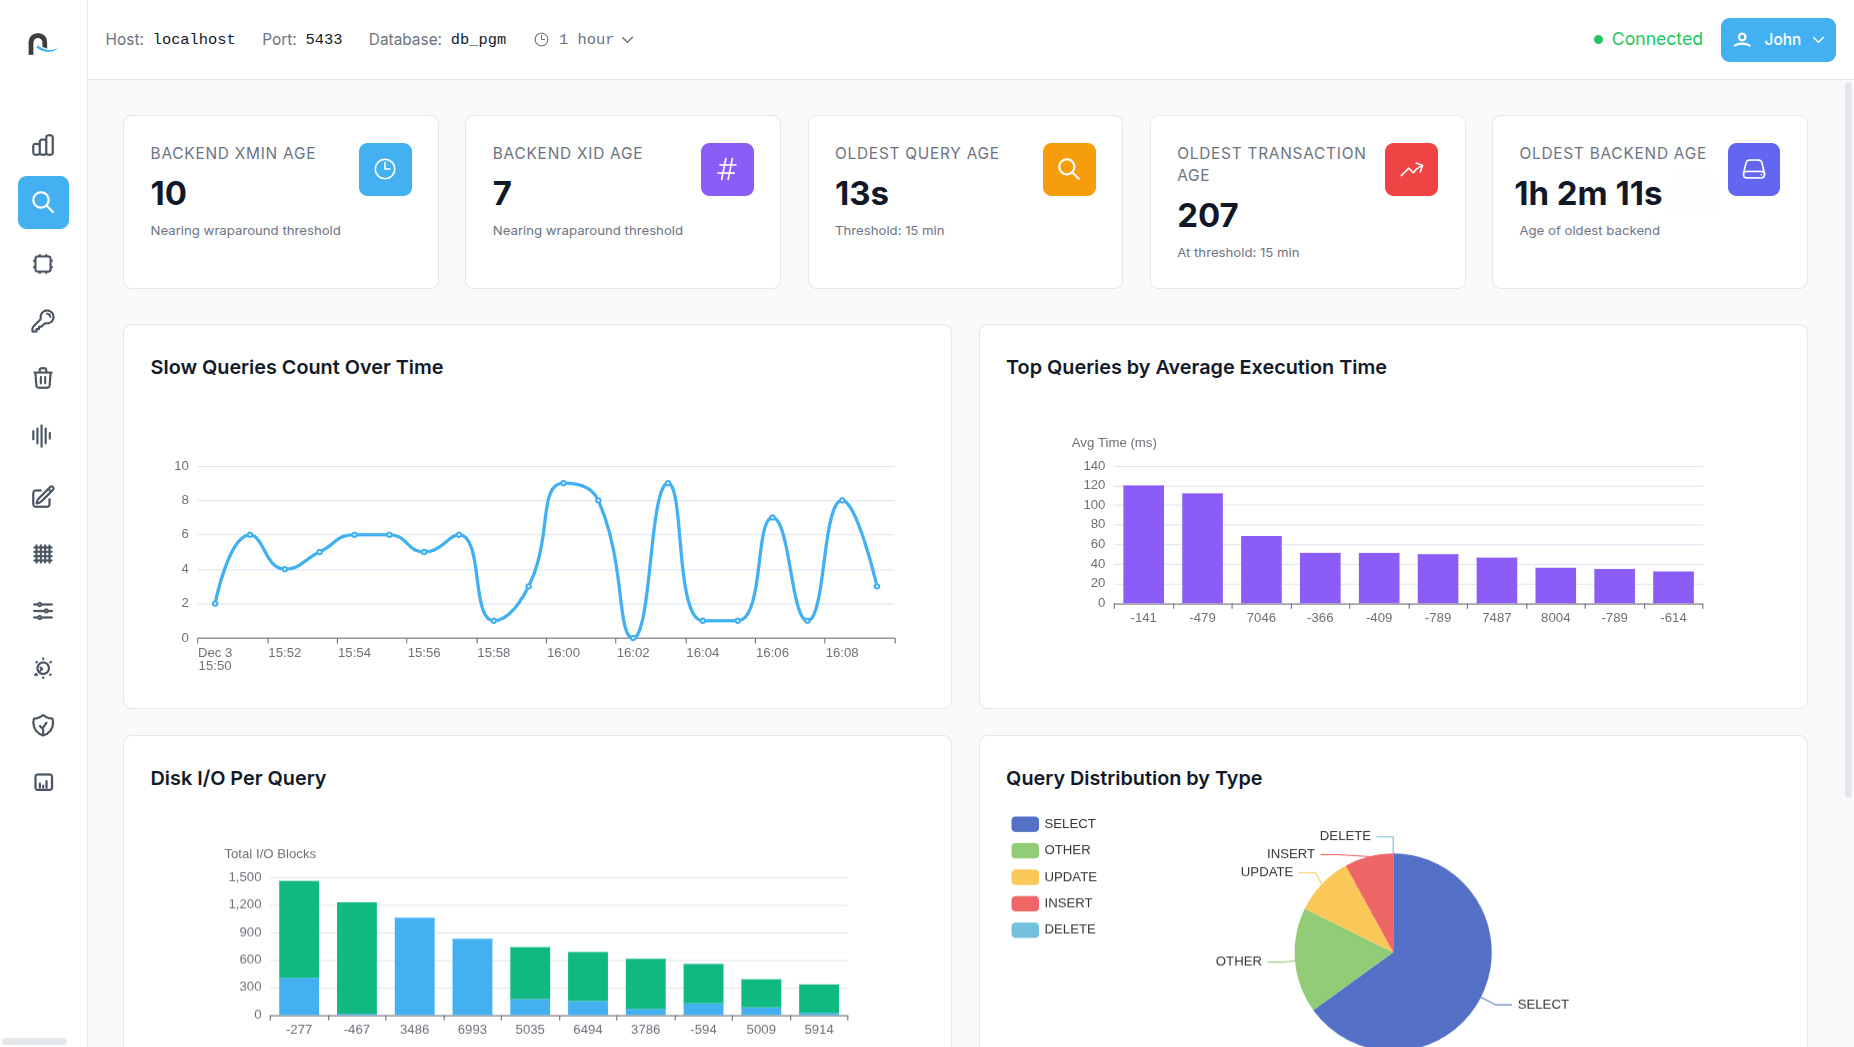
The tool offers a deep dive into critical performance indicators like backend xmin/xid age, the oldest active query, transaction, and backend age. It visually highlights slow queries, top queries by average execution time, disk I/O per query, and query distribution by type. PGTuner also provides a detailed breakdown of slow queries, enabling users to quickly identify inefficient workloads, pinpoint the exact query causing delays, and prioritize optimization efforts with clarity.

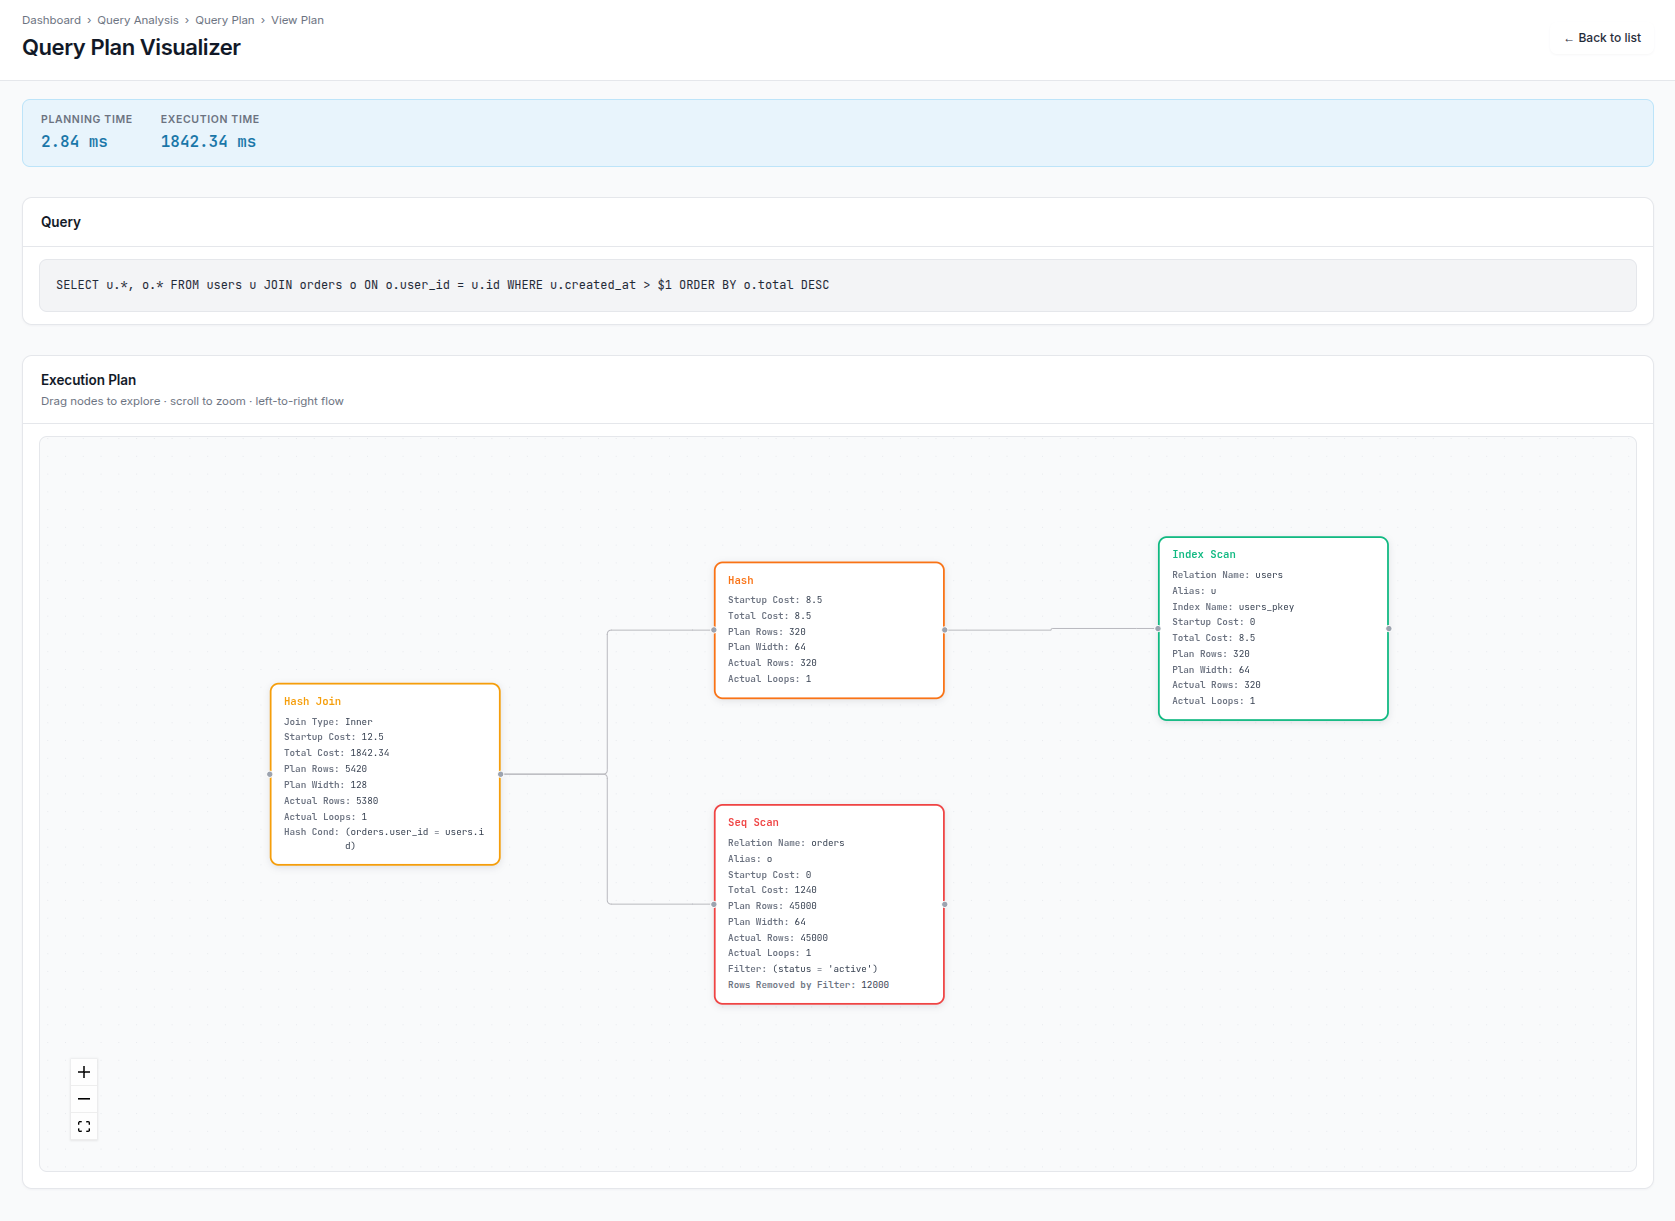
With a single click, complex execution plans are transformed into an intuitive visual tree. Every execution node—Sequential Scans, Index Scans, Nested Loops, Hash Joins, Join Filters, and more—is clearly represented with associated tables, filters, and conditions. This readable visual flow helps developers quickly spot performance bottlenecks such as slow scans, expensive loops, or poorly optimized joins, making plan interpretation significantly easier and more actionable.

PGTuner allows users to compare two query plans in a structured, visual format to understand how changes in indexing, filters, or query structure impact performance. The comparison highlights differences in planning time, execution time, total cost, loops, and rows processed. A visual diff of plan nodes makes improvements—or regressions—instantly visible. This gives teams the confidence to validate optimizations before deploying them into production.

Reveals real-time query waits, helping teams identify blocked or waiting operations instantly. It also highlights the top queries by total I/O usage, provides detailed resource consumption over time, and offers refined views of current query activity. Users can explore PostgreSQL’s query wait distribution and I/O usage breakdowns to better understand which workloads are consuming the most disk, CPU, and memory resources.

The Index Analysis dashboard provides visibility into total index count, index size, unused indexes, and their storage impact. It includes usage graphs, index type distribution, and a comparison of sequential scan versus index scan ratios. PGTuner also offers automatic index recommendations, highlights unused or redundant indexes, and displays full index definitions—helping users improve performance and reduce unnecessary storage consumption.

This section focuses on table health and storage efficiency by showing dead tuple trends per table, vacuum activity over time, total disk writes caused by vacuum operations, and the latest autovacuum timestamps. It also reports total dead tuple counts and lists current vacuum-related configuration parameters along with their active values. These insights make it easier to fine-tune autovacuum settings and maintain optimal table performance.

Table Analysis provides a clean, high-level snapshot of your table’s overall health and performance. It highlights essential metrics such as index scan ratio, write activity, dead tuple percentage, hot update efficiency, and fill factor, giving you an instant understanding of how well the table is optimized. Visual charts break down scan types and row operations, while quick-access stats reveal table size, index size, and bloat levels.
See it before you sign up
Walk through a live read-only dashboard wired to a fictional e-commerce database see the index advisor, query plan viewer, and vacuum forecasts without creating an account.
Monitoring 3 databases on Pro = $49/mo. Same simple math on every tier.
Free
For a single database.
Pro
For growing teams.
New agent at $39
Team
For production workloads.
New agent at $39 and new user at $10.
Need something larger? Talk to us about Enterprise volume pricing, on-prem, custom SLAs.
Yes — with full depth. Our pgtuner_agent_plus uses the AWS CloudWatch and CloudWatch Logs SDKs to pull metrics that would normally require a self-hosted collector. You get the same recommendation engine as self-hosted users.
A read-only role with access to pg_stat_* views and (on self-hosted) our pg_live_monitor extension. No access to your data rows, ever. Minimum role definition is on the security page.
Yes. The collection agent is a single binary.
No LLMs. Index recommendations are ranked by EXPLAIN ANALYZE cost deltas — a deterministic statistical method. Anomaly detection uses rolling p95 baseline comparison. We don't say \"AI\" without naming the method.
pganalyze is a great product with more name recognition and SOC 2 Type II. We go deeper on Postgres, offer a free tier, and cover more deployment targets.
